VIDEO SEARCH
2421 videos found

In this video, Dr. Adam Gower of GowerCrowd will be showing you how to raise money online for real estate projects and development through the utilization of digital marketing.
For the ultimate guide to real estate crowdfunding and syndication, subscribe now to the FREE GowerCrowd newsletter: https://bit.ly/3jRnlTv | Visit the GowerCrowd website, the most complete source of free real estate syndication and investing resources and training available anywhere: https://bit.ly/2VMA7ea | Are you a real estate developer? Read the new book, SYNDICATE and learn how to find more investors so you can raise more money: https://bit.ly/3jRUM8r | Are you a real estate investor? Watch this free webcast and discover the Hidden Secrets to Success in Real Estate Investing: https://bit.ly/2VJMcAN
GowerCrowd | Date Uploaded: August 13, 2021
| Date Created: July 14, 2019| Events / Webinars, Lending / Finance, Marketing/PR
| ALL
| ALL

On today's episode of #CoffeeBreak, CEO Larry Heard discusses what pandemic-related changes he thinks will remain, indoor air quality and touchless access, to name a few.
#CRE #commercialrealestate #realestate
Transwestern | Date Uploaded: August 12, 2021
| Date Created: | Commercial Properties for Lease, Commercial Properties for Sale, Brokerage, Economics/Market Reports/Research, Neighborhoods/Communities/Cities
| ALL
| ALL

The State of The New York Real Estate Market. Filmed Dec 28, 2020. Mariel Ebrahimi, CEO of DisruptCRE, talks Stuart Gelb, CEO of The Liquidity Source, about the state of the New York real estate markett.
DisruptCRE | Date Uploaded: August 09, 2021
| Date Created: December 28, 2020| Commercial Properties for Lease, Commercial Properties for Sale, Residential Properties for Lease, Economics/Market Reports/Research, Technology / Proptech
| Hospitality, Multifamily, Office, Retail, ALL
| NEW YORK

Highlights:
- New construction medical office building in West Chester
- On-site parking available
- Located on route 202 at a signalized intersection
- First floor: 2,000-8,400 SF
- Second floor: 2,000-8,400 SF
1074 Wilmington Pike, West Chester, PA 19382
Tri State Commercial Realty | Date Uploaded: August 06, 2021
| Date Created: | Commercial Properties for Lease
| Medical
| PENNSYLVANIA
Join our winning team.
https://tristatecr.com/careers
Tri State Commercial® Realty is a leading real estate advisory and brokerage firm specializing in commercial leasing and investment sales.
Highlighted by integrity, honesty, commitment to professionalism, and personalized service, Tri State Commercial® Realty, is a major player in the commercial real estate industry due to it’s solid client base of landlords, developers and credible tenants.
Tri State Commercial Realty | Date Uploaded: August 06, 2021
| Date Created: | Brokerage, Marketing/PR
| Office, Retail
| NEW YORK

Tune into this episode of #CoffeeBreak as CEO Larry Heard discusses the future of the #office sector, his forecast for occupancy rates, and how office buildings will come back into favor.
Transwestern | Date Uploaded: August 05, 2021
| Date Created: | Commercial Properties for Lease, Commercial Properties for Sale, Brokerage, Economics/Market Reports/Research, Neighborhoods/Communities/Cities, Property Management, REITs / Investment Funds
| Office, ALL
| ALL

Tri State Realty - Manhattan VS Brooklyn
Tri State Commercial Realty | Date Uploaded: August 03, 2021
| Date Created: | Commercial Properties for Lease, Brokerage, Neighborhoods/Communities/Cities, Marketing/PR
| Office, Retail
| NEW YORK
See what drew me to Brooklyn Commercial Leasing Market 1
Tri State Commercial Realty | Date Uploaded: August 03, 2021
| Date Created: | Brokerage, Neighborhoods/Communities/Cities, Marketing/PR
| Office, Retail
| NEW YORK
Tri State Realty - Structure & Tools that offer structure flexibility
Tri State Commercial Realty | Date Uploaded: August 03, 2021
| Date Created: | Brokerage, Marketing/PR
| Office, Retail
| NEW YORK

Tri State Commericlal - Use of Technology
Tri State Commercial Realty | Date Uploaded: August 03, 2021
| Date Created: | Brokerage, Technology / Proptech, Marketing/PR
| Office, Retail, ALL
| NEW YORK

In this video, we take a deep dive into the comparisons between the leading commercial real estate marketplace platforms, LoopNet and Crexi.
SUBSCRIBE to our newsletter to have the top stories hand-delivered to your inbox:
https://mailchi.mp/avisonyoung/netleasenews_signup
FOLLOW us on social media:
Instagram: @netleasebeast
Twitter: @netleasebeast
Facebook: https://www.facebook.com/NetLeaseBeast
Net Lease Beast - Landan Dory | Date Uploaded: August 03, 2021
| Date Created: | Commercial Properties for Lease, Commercial Properties for Sale, Brokerage, Tenant Concepts
| Retail, Other, Restaurant

Wondering what your Andover, Massachusetts commercial real estate value might be? Or how much would the right buyer pay for your Andover, MA commercial property today?
Commercial property value in Andover, Massachusetts fits into two markets -- the corporate user and the local services market. Investors like the Andover office and industrial market because of the access to a strong labor base, while the retail market serves a high-income population that demands amenities and services. In the last 12 months, over $70.1M in properties traded across nearly 256 buildings in a community of 36,403 people.
Get your Andover, Massachusetts commercial property value here: https://masscommercialproperties.com/...
MANSARD | Date Uploaded: August 02, 2021
| Date Created: | Commercial Properties for Sale, Brokerage
| Industrial, Office, Retail
| MASSACHUSETTS

Request a free consultation by calling (617) 674-2043 or visiting https://masscommercialproperties.com/
We all want to know where the commercial real estate market's headed. The problem is we don't the future. In this video, Jeremy Cyrier, CCIM walks through pricing trends, dollar volume and year over year comparisons for the greater Boston commercial real estate market so that you can sell your high value commercial property with confidence.
So where is the greater Boston commercial real estate market going to end in 2019?
Great question. So one of the things we do here at MANSARD, where we help owners find the right buyers for their high value commercial properties, is we track three counties: Rockingham, Essex, and Middlesex counties, which are west and north of Boston. The reason we do that is because those three counties, we find across the 80 towns that are included in them, share a very similar socioeconomic fabric.
Compared to last year, 2018 was really a record year for the greater Boston commercial real estate market.
We saw about $1.728 billion in volume, in the one to $20 million market, so record setter. Over the last 12 years, since 2006 to 2018, highest volume year to date. So 2019, where does that put us? Currently, on an annualized basis, we're looking at ending the year about 17% over the long-term average. So that means that we're above where the market typically trades on a long-term average since 2006, but we're not headed for a record year this year, compared to 2018. In fact, this time last year, in 2018, we were at 443 sales, this time, we're at 373. So what that tells us is the market slowed a little bit from last year, but the dollar values are still high. In fact, we're at about $1.2 billion in trades.
What does this mean for retail, office, flex, and industrial in the greater Boston commercial real estate market?
Well, office across those three counties, between one to $20 million is trading about 5% over its long-term average right now. In fact, that's down from 2018, which was showing an average price per square foot at $152 a foot. We're currently at about 113, does that mean the office market is correcting or softening? I don't believe so, I think it's too early to tell. There are some low basis trades in the volume that could be contributing to those numbers, so we'll need to see over the next couple of months how that shakes out.
Industrial, however, if you're reading the press, you're seeing that that's a very strong sector.
In fact, it's 43% over its long-term average. This is the best industrial market Boston's probably ever seen. Retail, 19% over its long-term average. In terms of value and flex, 25% over. So what does this all mean? How does it roll up? Well, with the feds lowering interest rates this year, I believe they've protracted the cycle, so we're definitely in a mature phase of the cycle, so we're still seeing high volume, but I am not seeing rapid appreciation this year. What I am seeing are very high values, a lot of investors looking for good deals, smart cash flows, long-term holds, but deals are still around. There's still great fundamentals of the market, and we're seeing the suburban markets still trade very actively.
I appreciate your checking us out. If you want to follow our greater Boston commercial real estate market updates, you can subscribe to our channel right here at YouTube or request a consultation at (617) 674-2043. Thank you.
Sales trends to watch in the Boston commercial real estate market: https://masscommercialproperties.com/...
In this video, Jeremy Cyrier, CCIM reviews the Rockingham, Middlesex and Essex County market in Massachusetts and New Hampshire, which includes the following towns:
Cambridge
Waltham
Marlborough
Framingham
Somerville
Woburn
Billerica
Newton
Lowell
Salem
Wilmington
Lawrence
Natick
Portsmouth
Peabody
Watertown
Danvers
Malden
Burlington
Andover
Everett
Haverhill
Bedford
Chelmsford
Medford
Lynn
Lexington
Beverly
Tewksbury
Arlington
Newburyport
Acton
North Andover
Reading
Saugus
Hudson
Concord
Holliston
Wakefield
Belmont
Methuen
Derry
Gloucester
Hopkinton
Westford
North Reading
Winchester
Seabrook
Seabrook
Salisbury
Littleton
Londonderry
Melrose
Wayland
Amesbury
Tyngsboro
Ipswich
Exeter
Hampton
Middleton
Ayer
Stoneham
Plaistow
Boxborough
Windham
Dracut
North Hampton
Rowley
Rowley
Hampstead
Swampscott
Epping
Epping
Chelsea
Newmarket
Rockport
Boxford
Groveland
Newtonville
Waban
MANSARD | Date Uploaded: August 02, 2021
| Date Created: November 15, 2019| Commercial Properties for Sale
| Industrial, Office, Retail, ALL
| MASSACHUSETTS

We all want to know where the next hot spot will be in the greater Boston commercial real estate market. But how? And how can we identify where those emerging markets will be? today Jeremy takes us through trends in the market and how the urban real estate cycle that's coming to an end will likely be followed by a suburban real estate cycle and which areas to watch.
We all want to get the right price for our high-value commercial properties. But it can be difficult to find the right buyer. In this free guide, I share steps to take to avoid doing a bad deal with the wrong buyer, which could end up costing you six to seven figures in sales proceeds.
Request your here: https://masscommercialproperties.com/...
Which Boston sub-market is most undervalued. Subscribe to our channel for tips to find the right buyer to sell your high-value commercial real estate with confidence.
So which sub-market around Boston is most undervalued? Well, in this market cycle we've been in, we've seen urbanization of the market and basically what's happened is employers and population have centralized in the city. That's been great. There's been a phenomenal expansion in Boston. A lot of construction has happened. And the inner burbs, so really still part of kind of the Boston socioeconomic center have also seen that same kind of expansion. As a result of that, we've seen a run-up and values. We've seen a lot of properties turning trading hands. So where does that leave undervalued opportunities? Well, here's where I see it happening. In the suburbs. In fact, it's the suburban belt between 128 and 495 that's where the next area of opportunity is. And the reason why I say that is because the population that's moved into the city has been driven primarily by millennials and retiring baby boomers.
The two things that they don't have are households with kids. That's something that's going to change. So millennials are going to start getting married, they're going to start having kids and one of the things they're going to consider is, "Where should we be living in order to provide the type of experiences that we have enjoyed in the city, but are also close enough to work where we can raise a family and enjoy yard, free parking off-street, and still have access or walkability to a nice town center?"
Between that 128 and 495 markets in that beltway, the towns that provide amenity basis, like a market street in Linfield or a shoppable walkable downtown like a Winchester or an Andover, those types of towns also have the amenities that are going to attract those folks and access to downtown Boston. The employers are going to stay there, they've made big capital investments to locate in the city. Moving back out to the suburbs is probably going to lag considerably. They'll probably end up following the employees back out to the burbs at some later date. So one of the things that I'd be looking at right now for the next cycle of growth, this will have been the urban cycle. The next cycle we go through will be this suburban expansion cycle. In that suburban expansion, you'll see the towns that I just mentioned, those types of communities, those are going to be the ones really draw and attract people. And when they come out and they start expanding in that market, you want to be positioned to capture that expansion and grow with the demand.
These are the communities in Massachusetts and New Hampshire that we serve:
Cambridge
Waltham
Marlborough
Framingham
Somerville
Woburn
Billerica
Newton
Lowell
Salem
Wilmington
Lawrence
Natick
Portsmouth
Peabody
Watertown
Danvers
Malden
Burlington
Andover
Everett
Haverhill
Bedford
Chelmsford
Medford
Lynn
Lexington
Beverly
Tewksbury
Arlington
Newburyport
Acton
North Andover
Reading
Saugus
Hudson
Concord
Holliston
Wakefield
Belmont
Methuen
Derry
Gloucester
Hopkinton
Westford
North Reading
Winchester
Seabrook
Seabrook
Salisbury
Littleton
Londonderry
Melrose
Wayland
Amesbury
Tyngsboro
Ipswich
Exeter
Hampton
Middleton
Ayer
Stoneham
Plaistow
Boxborough
Windham
Dracut
North Hampton
Rowley
Rowley
Hampstead
Swampscott
Epping
Epping
Chelsea
Newmarket
Rockport
Boxford
Groveland
Newtonville
Waban
MANSARD | Date Uploaded: August 02, 2021
| Date Created: | Commercial Properties for Sale, Brokerage, Economics/Market Reports/Research, Neighborhoods/Communities/Cities
| Industrial, Office, ALL
| MASSACHUSETTS

Where's the suburban Boston office market going to end in 2019 and trend in 2020? Is it poised for growth or contraction? Know what's happening to the office sales market so that you can accurately value your office property to sell it to the right buyer. In this video, Jeremy Cyrier walks through the $1M-$20M office sales market going covering data from 2006-2019 to answer your question as to whether the market's going up or down in 2019 into 2020.
Sell with confidence to the right buyer by finding out what your suburban Boston office building is worth in today's market. https://masscommercialproperties.com/...
Sales trends to watch in the Boston commercial real estate market: https://masscommercialproperties.com/...
Jeremy Cyrier: (00:00)
Where is the suburban office market around Boston going to wrap up in 2019 and head end of 2020? So one of the things that we look at, we track the market cycle, and we track data going back to 2006. And so what we've done today is we've taken this information and rolled it up, so we can share with you kind of what's happening. So here's the bottom line.
Jeremy Cyrier: (00:21)
Suburban office property, between $1 and $20 million is mainly steady as she goes. There's not anything crazy going on, on the high end or low end of the market. Dr. Glenn Mueller, whose market cycle data reports on the Boston MSA, shows us that the office market is in mid expansion. What that means is that the market is characterized primarily by rank growth and possibly movement into a phase of rapid rental appreciation, new construction.
Jeremy Cyrier: (00:50)
Although we're not really seeing that in the suburbs, we've seen it in Boston. This has been primarily characteristic of Boston as an urban office cycle, where you've seen a lot of new construction. But in the suburbs, 128, 495 and beyond, not a lot of new construction happening, unless you're in the 128 beltway around Burlington, Newton and Lexington.
Jeremy Cyrier: (01:12)
So what are we seeing? Well, long-term average for office property, between $1 and $20 million, from 2006 to 2019 has been about 96 deals per year. We've been above that long-term average since 2014, 2017 being the highest volume year with 128 sales. 2019, we're on track right now to end the year around 113 trades. So what that means is that we're pretty much steady as she goes, but we're not really seeing any explosive growth. That may come in the next market cycle, as the millennials start to move into the suburbs and look for employment closer to home, where they want to avoid traffic headed into Boston. So that's a possibility.
Jeremy Cyrier: (02:00)
We are seeing some velocity in office employment slow down a little bit, compared to the national average. I don't see that as alarming, given our unemployment rate in Massachusetts being at historic lows.
Jeremy Cyrier: (02:13)
So all-in-all, the office property market for the suburbs around Boston, steady as she goes. I don't see any warning signs at this point of any issues, but I also don't see any rapid rent appreciation coming.
Jeremy Cyrier: (02:26)
If you have more questions or want to reach out to us at (617) 674-2043, be happy to chat with you. Please be sure to subscribe to our channel on youtube. You'll get updates when we post new videos about the market. Thanks
MANSARD | Date Uploaded: August 02, 2021
| Date Created: | Commercial Properties for Sale
| Office
| MASSACHUSETTS

Precious L Williams is a 3-time #1 bestselling author of “Bad Bitches and Power Pitches” and her most recent book is “Pitching for Profit: The Bad Bitches’ Playbook to Convert Conversations into Currency”.
Watch here as Precious the #killerpitchmaster teaches the #CRELadiesGroup how to reframe the #perfectpitch.
Leeds Real Estate Group | Date Uploaded: July 30, 2021
| Date Created: | Events / Webinars, Property Management, ESG (Environmental, Social and Governance), Marketing/PR, Trade Groups
| ALL
| CALIFORNIA

Want to know how the industrial real estate market's moving in 2019 heading into 2020 for the Greater Boston area? In this video, Jeremy Cyrier, CCIM walks through sales and leasing data for the industrial market valued between $1M to $20M in Essex, Middlesex, and Rockingham counties west and north of Boston, Massachusetts.
Sales trends to watch in the Boston commercial real estate market: https://masscommercialproperties.com/...
Top 5 questions every owner should ask before choosing a commercial real estate broker: https://masscommercialproperties.com/...
So what's happening with the industrial market in greater Boston area? Well, taking a look at where we are mid quarter this 2019 it's still at peak. In fact, Dr. Glenn Mueller, who's Market Cycle Monitor we track, has the Boston MSA for industrial at peak. You can see it here. So let's take a look at the stats. What does this tell us? Well, going back and looking at 2019 year-to-date we've had a series of trades. In fact, we're on track right now to close the year at about 97 deals. Now it's off peak. 2018 saw over 41 deals more last year in the market. So what does that mean? Well, it means that deal velocity's slowing down a little bit. It hasn't impacted the average price per square foot. In fact, the average price per square foot for industrial, between one and 20 million, has gone up, and it's trading 42% over the longterm average running back to 2006. So it's definitely a hot segment.
And one of the things that's constraining growth in that market right now is the fact that we just don't have land in Essex, Middlesex, and Rockingham counties to develop new industrial buildings. The rents aren't high enough to support new construction, and the construction prices are so high. So let's look at the data. Average price per square foot for rents right now in this segment as reported by CoStar is $10.28 per square foot. So I went back to 2010 and looked at the trough in rents, and we're 32% higher. So if you had rented your building out in 2010 you should be seeing at least 32% higher rents today than you saw nine years ago. So that's definitely something that's impacting the valuations and the growth in the market. We're also seeing a tight market. In fact, the market's being reported as 3.5% vacant. That is really tight. And when you see that kind of vacancy rate in the market, we need new construction, or rents are going to go up to a point where tenants just can't afford to pay them anymore, and they're going to be frustrated because the market supply just cannot accommodate new industrial demand.
So an interesting situation we're in. Availability rate, which is the leading indicator for landlords expecting vacancy to come into their property, or available space to come into the property before it's gone vacant, is moving up a little bit. But we're not seeing any signs of a slow down in that sector in industrial. In fact the pricing is still appreciating, the rents are still going up. The only thing we're seeing is deal volume decline somewhat, and that may just be a result of either sellers, owners deciding to hold because you think you're going to get more in the next couple years, not knowing where to go with the money, or the fact that buyers just aren't willing to pay the prices. But we're still seeing trades happen, so I'm not sure that that's necessarily the case. Overall, I also look at GDP to get a sense of what's happening in the industrial sector. There is a correlation between manufacturing and GDP. So I pulled this chart here, and it basically shows that we're kind of staying flat on GDP. Nothing really exciting happening there. So, not seeing a leading indicator for change in the industrial market. So thanks for tuning in, watching us. Subscribe to our channel, and look forward to seeing you next time with the next market update. Thanks.
MANSARD | Date Uploaded: July 29, 2021
| Date Created: November 15, 2019| Commercial Properties for Sale
| Industrial
| MASSACHUSETTS

What's happening with the retail real estate market in greater Boston, Massachusetts? In this video, Jeremy Cyrier explains Mid Q4 2019 retail property sales and rental rate information for Rockingham, Essex, and Middlesex counties covering north and west of Boston into southern New Hampshire.
Sales trends to watch in the Boston commercial real estate market: https://masscommercialproperties.com/...
Get an industrial market update for greater Boston:
https://www.youtube.com/watch?v=esCE1...
Get an office market update for greater Boston: https://www.youtube.com/watch?v=uibdJ...
Find out the top 5 questions to ask your commercial real estate broker: https://masscommercialproperties.com/...
So, how's the retail market? I get that question quite a bit and it's a great question. If you read the news, all you're hearing about are big-box stores, department stores, and the Amazon effect.
But what's interesting about retail, particularly in the market that we track, which is the 1 to $20 million market for Rockingham, Essex and Middlesex counties, is that this market isn't necessarily following what you're seeing in the news. In fact, what we're seeing is continued appreciation. In fact, the average price per square foot for retail property, between 1 and 20 million, is currently trading at $221 a square foot. It's continued to appreciate, as have rents, from quarter four 2010 to quarter four 2019. The average rents for retail space are $23.20 a square foot. That's up 15.39% over the last nine years.
So, we're continuing to see appreciation in retail and we're continuing to see investors have appetite for retail, but what we are seeing is velocity slowing down a little bit. So, what I mean by that is that while prices are appreciating, the number of buildings that are trading by year are slowing a bit. In 2018, there were 59 more trades than there should be by the end of 2019. That's based on the annualized information that we project, following the activity in the market.
The vacancy rates are at 2.8%. Very low. This is 137 million square foot market. There's a lot of retail in the market. We are seeing a downtick in availability. So, what that means is that landlords aren't anticipating space coming back. But we are seeing some rental depreciation, so rents are are turning a little bit.
The Glenn Mueller market cycle chart shows us at peak for retail in our greater Boston MSA, as you can see here. So, definitely seeing signs of continued health and exuberance in the market. How long it'll go for, I don't know, but we are seeing a slight cooling in volume.
If you like getting these market updates, please subscribe to our channel. We look forward to getting you the next one. Thanks.
MANSARD | Date Uploaded: July 29, 2021
| Date Created: November 15, 2019| Commercial Properties for Lease, Commercial Properties for Sale, Brokerage, Economics/Market Reports/Research
| Retail
| MASSACHUSETTS

We all want to know what's happening with the Woburn industrial space market. What's sold this year? How much are Woburn industrial buildings selling for? And what's going on with rental rates in Woburn, Massachusetts? In this video, Jeremy Cyrier, CCIM walks through 2019 Woburn industrial space market data so you can sell your Woburn industrial property with confidence.
Sales trends to watch in the Boston commercial real estate market: https://masscommercialproperties.com/...
Links we're sharing with you to new PDF reports:
Top 5 questions to ask your commercial real estate broker: https://masscommercialproperties.com/...
Get your Woburn industrial property valued by an expert: https://masscommercialproperties.com/...
The best way to sell industrial property: https://masscommercialproperties.com/...
So what's going on with the Woburn industrial market just outside of Boston? Well, that's a great question. So we help owners of high value commercial properties sell their assets to the right buyer for the right price so they can sell with confidence. So one of the things we've done is we've gone back and looked at the Woburn market over the last 12 months and Woburn, with its position located at the intersection of 93 and 95, is ideally located to service a lot of industrial requirements from warehouse distribution, Flex/R&D. So what's going on there? Well, this 13.7 million square foot market has actually been pretty quiet over the last 12 months. In fact, there have been only a few trades. There was a large to $230 million portfolio that traded, which was net lease to Harvey Building Products. That portfolio was located throughout New England and Pennsylvania with three of the properties on Commonwealth drive in Woburn. So that's sort of an outlier in terms of what the local market's doing.
What we do see is the local markets performing in a very tight and constricted way. In fact, there's not a lot of inventory trading. What we're seeing in CoStar is a 2.7% vacancy rate. And with the few trades that are happening in the market, what this is telling us is that most owners are holding their assets. They're not selling these buildings. There's a high demand for them. The average price per square foot is running about $133 for industrial and Flex. And CoStar's reporting a cap rate of 6.9% with average rental rates at $14.32. So typically what we see in a market like this where owners are looking at and appreciating upward trend, they will hold unless there's a reason to sell.
So as a result of that, we're seeing an upward pressure on pricing for these buildings. We're seeing upward pressure on rent for these properties. And there's really not a lot of room here in the market to build any new product. So it's constricted, it's tight. We have seen the trades that are occurring over the last 12 months at 20 Sonar. That sold for 136 bucks a square foot. 11 Wheeling is traded at 118 a square foot. 1 Walnut Hill at 116 a foot. And 79 Pine at $85 a square foot.
So if you have other questions about what's happening in the Woburn market and when this market might open up for more opportunities to take advantage of these market trends, feel free to reach out. We're available for consultations. But in the meantime, if you like what you're getting here, please subscribe to our channel for more market updates. Thank you.
MANSARD | Date Uploaded: July 29, 2021
| Date Created: November 15, 2019| Commercial Properties for Sale, Brokerage, Economics/Market Reports/Research
| Industrial
| MASSACHUSETTS
We all want to know what's happening with Wilmington MA industrial property sales trends. That way we can make the best real estate decisions at the right time in the market. In this video, Jeremy Cyrier, CCIM provides an update on 2019 Wilmington MA industrial property sales trends.
Sales trends to watch in the Boston commercial real estate market: https://masscommercialproperties.com/...
The best way to sell commercial real estate for the right price: https://masscommercialproperties.com/...
The top 5 questions to ask your commercial real estate broker: https://masscommercialproperties.com/...
Woburn industrial space market stats: https://masscommercialproperties.com/...
What’s going on with the Wilmington MA industrial sales trends market?
Owners of high-value commercial real estate come to us when they’re having difficulty finding the right buyers so they can sell with confidence. So what’s going on in Wilmington? Well, Wilmington’s been a much more active markets and the Woburn market has. In fact, Wilmington tends to be a spillover market from its sibling Woburn.
Wilmington Industrial Property Market Stats: 2019
What we’re seeing in this 9.8 million square foot industrial flex market, is an average transaction value in 2019, of $119 a square foot. CoStar’s reporting cap rates in this market at 6.9%, and rents are averaging $11 and 98 cents a square foot. Vacancy rate’s running 6.2% which is much higher than Woburn, which is currently at about 2.7%. so what does this tell us? What this tells us is that Wilmington often tends to be a spillover market from Woburn in the three zones in Wilmington that you see having spillover. The 38 corridor, the 129 exit at 93, as well as Concord street, and then the Ballardvale section of Wilmington.
Wilmington Outsells Woburn in 2019
So some of the recent transactions that are pushing the values, the highest one on record this year is 300 Ballardvale, which was the Monogram Foods acquisition. That building traded at 300 Ballardvale for $213 a square foot. That was followed by the sale of three Jonspin Road properties, 46 53 and 55 Jonspin, at $145 a square foot. And then 44 Concord street at 147.50 a square foot. Wilmington Technology Park, that portfolio of four buildings, that traded for $133 a square foot.
So overall Wilmington, much more active market on the sales side in 2019 than its sibling market, Woburn. And we’ll see what 2020 has in store. So if you’re interested in receiving market updates, subscribe to our channel and we’ll talk to you soon. Thanks.
MANSARD | Date Uploaded: July 29, 2021
| Date Created: | Commercial Properties for Sale, Economics/Market Reports/Research
| Industrial
| MASSACHUSETTS

Sales trends to watch in the North Reading, MA industrial real estate market -- in this video Jeremy Cyrier, CCIM briefs us on 2019's most notable industrial real estate sale as well as rental rate and vacancy trends.
Sales trends to watch in the Boston commercial real estate market: https://masscommercialproperties.com/...
The best way to sell commercial real estate for the right price: https://masscommercialproperties.com/...
The top 5 questions to ask your commercial real estate broker: https://masscommercialproperties.com/...
Woburn industrial space market stats: https://masscommercialproperties.com/...
So, how was the North Reading industrial market in 2019? Once we wrapped up the year, North Reading is a relatively small market. It's about 1.7 million square feet of industrial and flex property. There's not a whole lot going on there, but the market dynamics are very positive because of the short supply and its strategic location to 93. So, at MANSARD, what we do here is we help owners of high value industrial and flex properties in North Reading find the right buyers who perform so that you can sell your property with confidence.
So, in this market in 2019 the average price per square foot came in at $139 per square foot. So, that's a rich price for industrial and flex in this market. It exceeds the average price per square foot for industrial and flex throughout the Rockingham Essex and Middlesex County markets. CoStar reports the average cap rate in North Reading has been 7.2% in 2019 and the average rental rate has been trading around $13.98 a square foot.
Virtually a fully occupied market. There's hardly any vacancy in North Reading, and what we've seen in the market is anything that does come available tends to move very quickly. The most notable sale of the year was 217 R Main Street in North Reading. That building sold for $3.6 million or $105 a square foot. If you'd like more information about what's happening in North Reading, please feel free to reach out or you can subscribe here to our market updates. Look forward to seeing you again. Thank you.
MANSARD | Date Uploaded: July 29, 2021
| Date Created: December 31, 2019| Commercial Properties for Sale, Economics/Market Reports/Research
| Industrial
| MASSACHUSETTS

What's happening in the Cambridge industrial and flex market in 2019-2020? In this video Jeremy Cyrier, CCIM delivers a brief update on the state of the market, recent sales trends, pricing, cap rates, and rental rates.
Sales trends to watch in the Boston commercial real estate market: https://masscommercialproperties.com/...
The best way to sell commercial real estate for the right price: https://masscommercialproperties.com/...
The top 5 questions to ask your commercial real estate broker: https://masscommercialproperties.com/...
Woburn industrial space market stats: https://masscommercialproperties.com/...
MANSARD | Date Uploaded: July 29, 2021
| Date Created: | Commercial Properties for Sale, Economics/Market Reports/Research
| Industrial
| MASSACHUSETTS

Here's a hint: your commercial property buyer probably already owns a similar property in your area. Studies show that people who own similar property to the one you're selling are more likely to agree with your price and perform.
Sales trends to watch in the Boston commercial real estate market: https://masscommercialproperties.com/...
The best way to sell commercial real estate for the right price: https://masscommercialproperties.com/...
The top 5 questions to ask your commercial real estate broker: https://masscommercialproperties.com/...
Woburn industrial space market stats: https://masscommercialproperties.com/...
MANSARD | Date Uploaded: July 29, 2021
| Date Created: | Commercial Properties for Sale, Brokerage
| Industrial, Office, ALL

Access the Q1- 2020 PDF market report: https://mansard.lpages.co/market-repo...
How's the market? In this video, you'll learn how Q1 - 2020 started and how the COVID-19 shutdown is affecting commercial real estate sales transactions. The data covers office, industrial, retail, and flex properties valued between $1M - $20M in Rockingham, Middlesex, and Essex Counties.
--------------------
Like what you see? Go to: https://masscommercialproperties.com/...
MANSARD | Date Uploaded: July 29, 2021
| Date Created: | Commercial Properties for Sale, Economics/Market Reports/Research
| Industrial, Office, Retail, ALL
| MASSACHUSETTS

In this video, watch a data-driven update on the Greater Boston commercial real estate sales trends to watch. Today, we cover what's happening in the second quarter of 2020 in the Rockingham, Essex, and Middlesex county markets for office, retail, and industrial properties.
Download our PDF market report at https://masscommercialproperties.com/...
Discover your commercial property valuation: https://masscommercialproperties.com/...
Some people are asking "will commercial real estate crash?": https://masscommercialproperties.com/...
MANSARD | Date Uploaded: July 29, 2021
| Date Created: | Commercial Properties for Sale
| Industrial, Office, Retail, ALL
| MASSACHUSETTS
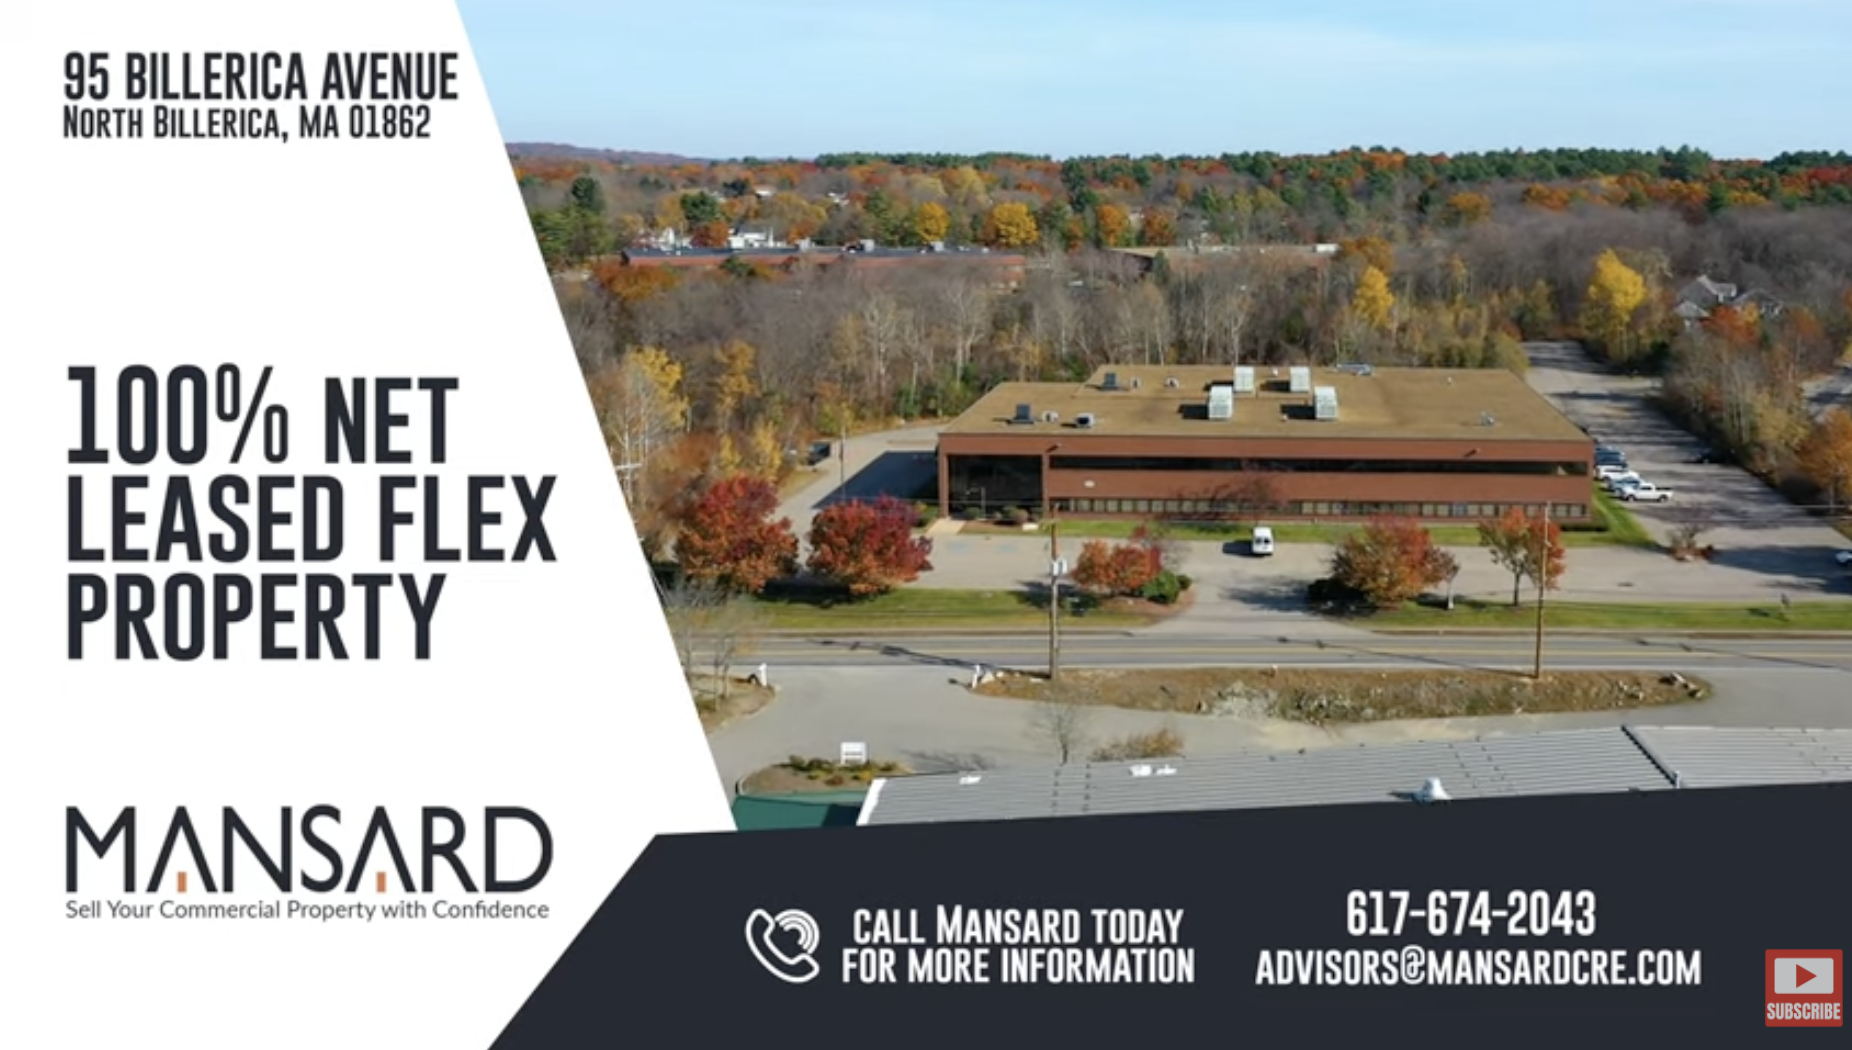
95 Billerica Avenue is a 74,031 SF Flex property that is 100% leased to Aved Electronics (A Lithion Company) and Cristek Interconnects -- two world-class contract manufacturers. The property features a newly installed freight lift along with a renovated, two-story atrium, lobby, brand new second story floor windows installed in 2020, two tailboard loading docks, and abundant employee parking. The second floor has been built out to accommodate Aved's expansion, leased to Aved at a below-market rental rate, as well as Cristek's new growth. The property offers a weighted average lease term of 6 years with a net operating income of $672,430 with 15% contractual NOI growth over the lease term.
MANSARD | Date Uploaded: July 29, 2021
| Date Created: | Commercial Properties for Sale
| Industrial, Mixed-Use: Industrial / Office
| MASSACHUSETTS

Making the decision to sell your commercial property involves a thoughtful analysis of the pros and cons of doing so.
That decision is only made easier by working with an astute and experienced commercial property broker who is an expert in high-value commercial property sales. Through their expertise, you will get the high value offer you want and maximize the return on your investment. Sell your commercial property with confidence with MANSARD. Contact us, and we’ll discuss what makes your commercial property unique.
Contact MANSARD at (617) 674-2043 • advisors@mansardcre.com
https://masscommercialproperties.com/...
MANSARD | Date Uploaded: July 29, 2021
| Date Created: | Commercial Properties for Sale, Brokerage, Marketing/PR
| Office, ALL
| MASSACHUSETTS

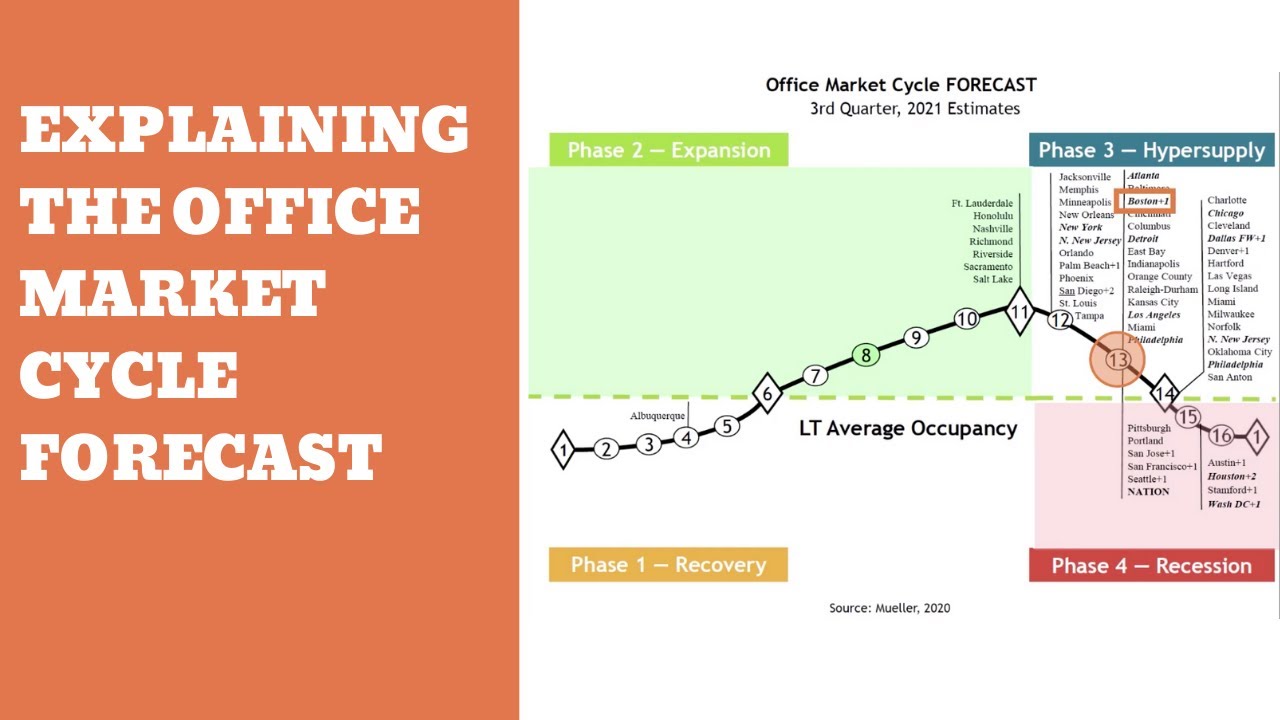
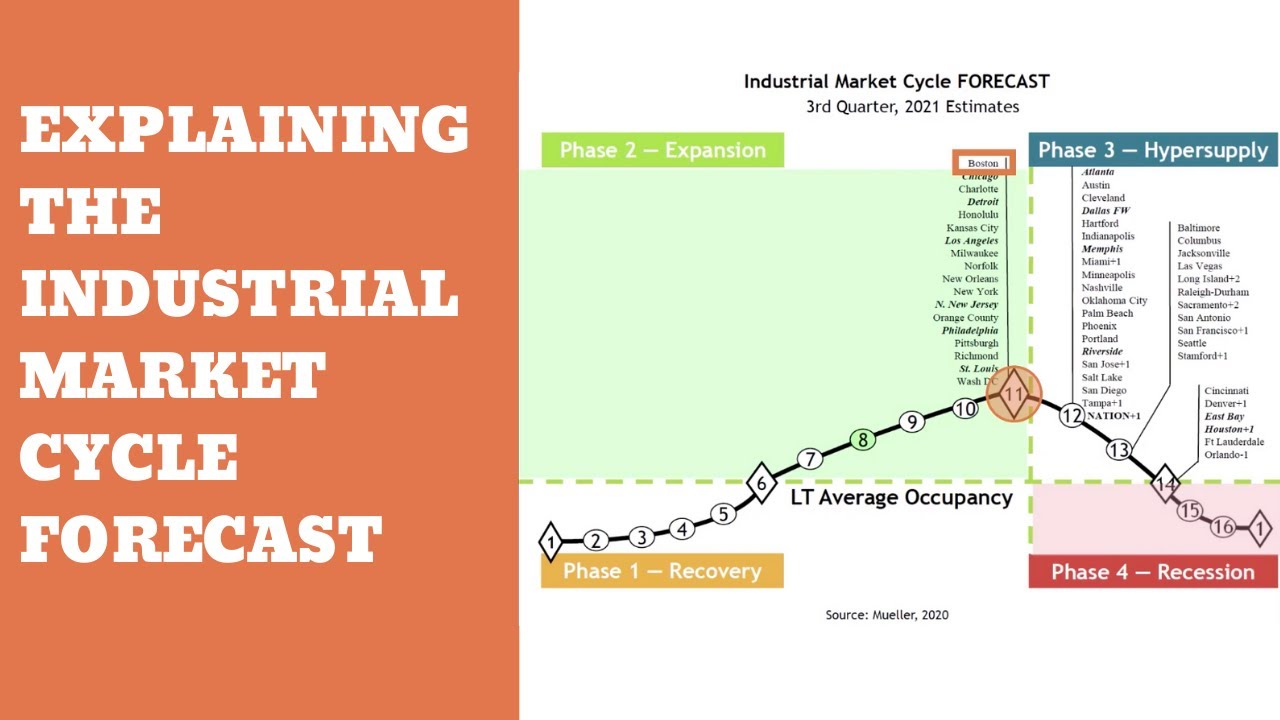
The four quadrants of the market cycle include:
Recovery Phase
Expansion Phase
Hyper Supply Phase
Recession Phase
Contact MANSARD today at (617) 674-2043 • advisors@mansardcre.com
Visit us at masscommercialproperties.com
MANSARD | Date Uploaded: July 29, 2021
| Date Created: | Commercial Properties for Lease, Commercial Properties for Sale, Economics/Market Reports/Research
| Office, ALL
| ALL
Contact MANSARD today at (617) 674-2043 • advisors@mansardcre.com
Visit us at masscommercialproperties.com
MANSARD | Date Uploaded: July 29, 2021
| Date Created: | Commercial Properties for Sale, Economics/Market Reports/Research
| Office
| MASSACHUSETTS
Contact MANSARD today at (617) 674-2043 • advisors@mansardcre.com
Visit us at masscommercialproperties.com
MANSARD | Date Uploaded: July 29, 2021
| Date Created: | Commercial Properties for Sale
| Industrial
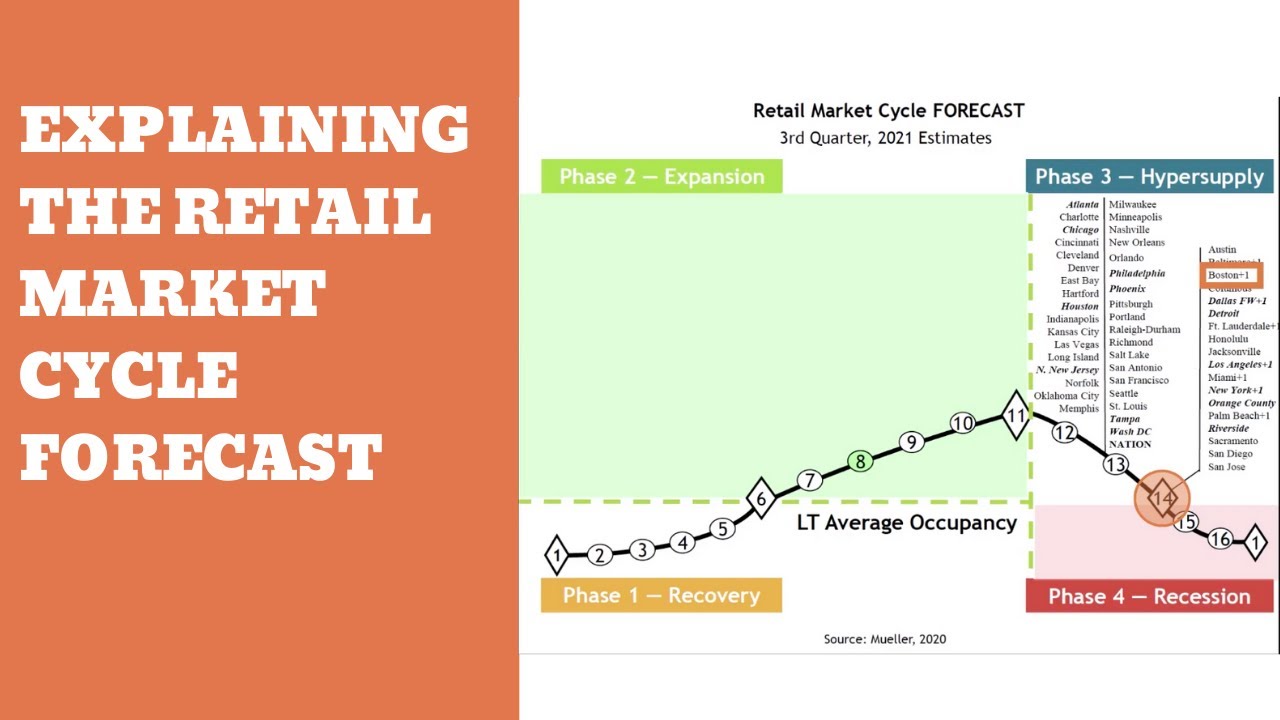
A 3rd Quarter, 2021 look into retail.
Contact MANSARD today at (617) 674-2043 • advisors@mansardcre.com
Visit us at masscommercialproperties.com
MANSARD | Date Uploaded: July 29, 2021
| Date Created: | Commercial Properties for Sale
| Retail

Contact MANSARD today at (617) 674-2043 • advisors@mansardcre.com
Visit us at masscommercialproperties.com
MANSARD | Date Uploaded: July 29, 2021
| Date Created: | Commercial Properties for Sale

After eight cash offers in 18 days, this industrial building outsold its peers by $250,000. Dependable Masonry, the 40-year owner of 73 Concord Street, retired from the property.
Each year, they spent $35,000 in taxes, insurance, and maintenance, struggled with management, and ultimately faced a capital gains tax bill of nearly $400,000 upon sale. They reinvested their profits in property leased by a New York Stock Exchange-traded company, paying him $100,000/year in net cash flow until 2032. Their new tenant manages, pays the tax bill, and maintains the building.
Here's how it happened.
In-depth market data and market cycle analysis showed that the industrial market's expansion would pay off for Dependable. Once they realized the time was right to capture maximum pricing, they agreed to follow our pricing guidance. Our market research revealed that 8.2% of the industrial buyers in the area would purchase and use similar properties for their own business.
Also, the property should be offered to the brokerage community so that any brokers representing high-intent buyers would bring them to Dependable Masonry. Ten days after launching the MANSARD proprietary marketing process, Dependable Masonry received eight offers, hosted 18 tours, and followed our negotiation advice to reach an agreement.
Once the offer was accepted, Dependable Masonry's legal and tax team wrapped up the tax planning. That's when they decided to pursue a 1031 strategy to save nearly $400,000 in capital gains taxes. After six weeks of investment review meetings, Dependable Masonry selected the top investment opportunity -- a Dollar General, an NYSE-traded company, with 12 years remaining on its initial lease term.
The 1031 exchange allowed Dependable Masonry to save the capital gains taxes and start generating $100,000/year in free cash flow 45 days after the sale of their headquarters.
We love to see our clients win. Want to see how to sell your property with confidence and reinvest the proceeds for increased cash flow and fewer headaches? Request your consultation today.
When you reach out to us, we'll schedule a discovery call. We want to know everything about your property and your goals so we can match you with the right buyer who will pay the most, close on time, and keep issues in check to get the deal done.
Next, we will create a thorough plan to sell your property and share it with you. We market your property until the day of the closing. You're never in the dark with MANSARD.
To help you make a smart deal, we'll keep you informed while we aggressively market your property using our 42-point proprietary sales process. 88.9% of MANSARD deals close on time at the seller's accepted offer price. That means less hassle, lower stress, and more celebrating.
Request your consultation today. Click here: https://Mansard.as.me/
MANSARD | Date Uploaded: July 27, 2021
| Date Created: | Commercial Properties for Sale, Brokerage, Marketing/PR
| Industrial
| MASSACHUSETTS

100% leased Class "A" office building in Las Vegas, NV for sale.
Cushman & Wakefield - Marlene Fujita | Date Uploaded: July 27, 2021
| Date Created: | Commercial Properties for Sale
| Office
| NEVADA

As the economy heats up and demand remains strong for raw materials, are manufacturers expanding their operations to meet the need? John Ferruzzo weighs in on this episode of Coffee Break.
Transwestern | Date Uploaded: July 23, 2021
| Date Created: | Commercial Properties for Lease, Commercial Properties for Sale, Lending / Finance, REITs / Investment Funds
| Industrial, Mixed-Use: Industrial / Office, Mixed-Use: Industrial / Retail
| ALL

How are Crane-Served Projects Performing?
With a favorable interest rate market, crane-served industrial projects are seeing tenants become owners. Hear more from niche expert, John Ferruzzo on this episode of Coffee Break.
Transwestern | Date Uploaded: July 23, 2021
| Date Created: | Commercial Properties for Lease, Commercial Properties for Sale, Lending / Finance, REITs / Investment Funds
| Industrial, Mixed-Use: Industrial / Office, Mixed-Use: Industrial / Retail
| ALL

How are Tenant Needs Impacting Industrial Projects?
Taller clear heights and higher parking ratios are being factored into new industrial builds. Is this being driven by tenant needs or by investors buying for the future? Industrial expert, Brian Gammill weighs in on this episode of Coffee Break.
Transwestern | Date Uploaded: July 23, 2021
| Date Created: | Commercial Properties for Lease, Commercial Properties for Sale, Construction, Lending / Finance, REITs / Investment Funds
| Industrial, Mixed-Use: Industrial / Office, Mixed-Use: Industrial / Retail
| ALL

Are New Tenants Driving Industrial Demand?
494.9 MSF of industrial space is under construction nationwide. Are there new industrial tenants to fill it? In this episode of Coffee Break, industrial expert Brian Gammill gives us a peek at what he’s seeing. Check out our 1Q National Industrial report for more insights.
Transwestern | Date Uploaded: July 23, 2021
| Date Created: | Commercial Properties for Lease, Commercial Properties for Sale, Construction, Development/Planning/Entitlements, Lending / Finance, REITs / Investment Funds
| Industrial, Mixed-Use: Industrial / Office, Mixed-Use: Industrial / Retail
| ALL

What is driving the Industrial Investment Market? Aside from the "Amazon effect" - what is driving the industrial market? Houston's Brian Gammill discusses the bond market and real estate allocations from domestic funds and sovereign capital in this edition of Coffee Break.
Transwestern | Date Uploaded: July 23, 2021
| Date Created: | Commercial Properties for Lease, Commercial Properties for Sale, Construction, Development/Planning/Entitlements, Lending / Finance, REITs / Investment Funds
| Industrial, Mixed-Use: Industrial / Office, Mixed-Use: Industrial / Retail
| ALL

In this recap, we discuss the consequences of Biden's proposed cap on 1031 exchanges on the real estate investment market. We also take a look at recent developments by Dollar General and 7-Eleven.
SUBSCRIBE to our newsletter to have the top stories hand-delivered to your inbox: https://mailchi.mp/avisonyoung/netleasenews_signup
FOLLOW us on social media:
Instagram: @netleasebeast
Twitter: @netleasebeast
Facebook: https://www.facebook.com/NetLeaseBeast
LinkedIn: https://www.linkedin.com/company/net-lease-beast
If we can help you with any of your real estate needs, please don't hesitate to reach out via email at landan.dory@avisonyoung.com or at 432-288-7162. For more information, please visit netleasebeast.com and avisonyoungnetlease.com.
Net Lease Beast - Landan Dory | Date Uploaded: July 20, 2021
| Date Created: | Commercial Properties for Lease, Commercial Properties for Sale, Brokerage, Lending / Finance, Tenant Concepts
| Hospitality, Retail, Other, Automotive, Restaurant
| ALL

In this weekly recap, we take a deeper look at the consequences of Biden's cap on 1031 exchanges on the STNL real estate investment market. Additionally, we discuss new developments regarding Jack in The Box and Applebee's.
SUBSCRIBE to our newsletter to have the top stories hand-delivered to your inbox: https://mailchi.mp/avisonyoung/netleasenews_signup
FOLLOW us on social media:
Instagram: @netleasebeast
Twitter: @netleasebeast
Facebook: https://www.facebook.com/NetLeaseBeast
LinkedIn: https://www.linkedin.com/company/net-lease-beast
If we can help you with any of your real estate needs, please don't hesitate to reach out via email at landan.dory@avisonyoung.com or at 432-288-7162. For more information, please visit netleasebeast.com and avisonyoungnetlease.com.
Net Lease Beast - Landan Dory | Date Uploaded: July 20, 2021
| Date Created: | Commercial Properties for Lease, Commercial Properties for Sale, Brokerage, Tenant Concepts
| Hospitality, Retail, Other, Restaurant
| ALL

The CRE Firm Hybrid model of how Technology improves human efficiency
Tri State Commercial Realty | Date Uploaded: July 20, 2021
| Date Created: | Brokerage, Technology / Proptech
| Multifamily, Office, Retail
| NEW YORK
Why did we expand specifically to Philly
Tri State Commercial Realty | Date Uploaded: July 20, 2021
| Date Created: | Brokerage, Neighborhoods/Communities/Cities, Marketing/PR
| Multifamily, Office, Retail
| PENNSYLVANIA
TSC Precision Recruiting Video May2021
Tri State Commercial Realty | Date Uploaded: July 20, 2021
| Date Created: | Brokerage, Marketing/PR
| Multifamily, Office, Retail
| PENNSYLVANIA
Shlomi Bagdadi on Tri State Commercial's Rise to a Brooklyn Powerhouse. Aril 28, 2021.
Tri State Commercial Realty | Date Uploaded: July 20, 2021
| Date Created: | Brokerage, Neighborhoods/Communities/Cities
| Multifamily, Office, Retail
| NEW YORK

Highlights:
- Lot size: 9,830 SF
- Building size: 7,521 SF
- Prime development opportunity on Broad St
- Just steps away from Passyunk Ave
- On-site parking available
1900 S Broad St, Philadelphia, PA 19145
Tri State Commercial Realty | Date Uploaded: July 20, 2021
| Date Created: | Commercial Properties for Sale, Development/Planning/Entitlements
| Land, Office
| PENNSYLVANIA

Slideshow of recent work completed by STREAMLINE BUILDERS INC., LOS ANGELES
General Contracting & Construction Management. As premium builders and trusted collaborators, we effectively execute every phase and detail of your project to deliver exceptional quality, beautification, and an excellent return on your investment. Since 2010, we’ve been proudly serving Southern California, from Long Beach to Ventura.
Streamline Builders | Date Uploaded: July 15, 2021
| Date Created: | Construction, Marketing/PR
| Multifamily
| CALIFORNIA

Project: Resurfacing of pool and multi-use rooftop decks overlooking DTLA. This resort-inspired rooftop pool and spa deck were completely renovated by Streamline Builders, Inc. of Santa Monica.
Streamline Builders | Date Uploaded: July 15, 2021
| Date Created: | Construction, Landscaping
| Multifamily
| CALIFORNIA

NoHo14 Multi-Family Remodel North Hollywood. This video is of a lobby renovation were we gutted it, added new wall paneling, flooring, new polished concrete floors, new business lounge upstairs and offices.
Created Dec 16, 2017.
Streamline Builders | Date Uploaded: July 15, 2021
| Date Created: | Construction, Interior Design
| Multifamily
| CALIFORNIA

The Pointe - Pool Deck & Sun Lounge Renovation by Streamline Builders.. Nov, 2017
Streamline Builders | Date Uploaded: July 15, 2021
| Date Created: | Construction, Landscaping
| Multifamily
| CALIFORNIA